
Executive Summary
- The economy proved more resilient than expected despite a severe but fluctuating oil shock, supported by inventories, moderate demand destruction outside the U.S. and Europe, policy flexibility, China’s stockpile drawdowns, and an ongoing capex boom.
- Inflation remains the central risk: supply shocks, AI-related capex, reshoring, tariffs, labor constraints, and fiscal stimulus are keeping pricing pressures elevated, which a now more hawkish Fed feels it is time to nip in the bud.
- The second quarter’s increase was one of the strongest equity market gains in the last 100 years. The rise has been driven largely by increasing earnings growth expectations of AI infrastructure and technology companies. Meanwhile, greater market dispersion and a lower correlation among S&P 500 stocks are creating a strong case for greater diversification in attractively valued quality stocks lower down the market-cap spectrum.
| Index | YTD | 2Q | 1Y | |
|---|---|---|---|---|
| S&P 500 | U.S. Large Cap | 10.21% | 15.20% | 22.32% |
| DJIA | U.S. Large Cap | 9.76 | 13.38 | 20.65 |
| Russell 3000 | U.S. All Cap | 10.88 | 15.44 | 22.82 |
| Russell 2000 | U.S. Small Cap | 22.57 | 21.49 | 40.78 |
| MSCI EAFE | Developed International | 9.44 | 10.82 | 20.23 |
| MSCI EM | Emerging Markets | 23.85 | 24.05 | 43.51 |
| Bloomberg U.S. HY | U.S. High Yield | 1.96 | 2.47 | 5.91 |
| Bloomberg U.S. Agg | U.S. Core Bond | 0.62 | 0.67 | 3.79 |
| Bloomberg Muni | U.S. Muni Bond | 2.32 | 2.50 | 7.03 |
| MSCI U.S. REIT GR | U.S. Real Estate | 17.58 | 12.15 | 21.15 |
Total Returns
Source: FactSet, William Blair Equity Research
A Resilient Economy Weathers the War but Still Struggles With High Inflation
Perhaps the most important development in the past quarter was what did not happen. With crude oil prices increasing to a peak of $118.35 per barrel at the very start of the quarter, gasoline prices rising from below $3 per gallon to above $4.50, and the Strait of Hormuz remaining closed effectively until the end of the quarter, the economy did not experience a recession and the equity market did not decline. This defied expectations from just about all commodity experts who, before this, would quite reasonably have listed the closure of the strait for more than four months as an almost certain catalyst for a global recession.
Exactly why such a disaster did not occur came down to a combination of inventories, the waiving of Russian oil sanctions, demand destruction (across Southeast Asia, Australia, South Korea, and India, though not much in Europe or North America), and, importantly, China reducing its oil imports by about 40%.
China’s ability to draw down energy and other commodity stockpiles that had previously not been known about was a major surprise, which greatly helped provide global economic stability. One of the lessons from this crisis (which continues with news each day) is that countries should take a note out of China’s playbook and be prepared. In a new multipolar world, where access to raw materials can easily be blocked or face major disruptions, countries should make sure they have strategic reserves available for such events. A key competitive advantage of the United States is that we are energy independent.
Helping stabilize the economy is a resilient U.S. consumer with strong household balance sheets, reasonable levels of debt service, and close to full employment. Additionally, the U.S. is in the midst of one of the largest capex booms in history, with billions of dollars being poured into a combination of AI infrastructure expansion (e.g., data centers) and energy production to support its development. The downside of this expenditure, however, is that inflationary pressures are elevated. In this model, inflationary spending necessarily comes first, with the disinflationary productivity gains expected to follow. We are still in the enabling phase and not yet in the adoption phase.
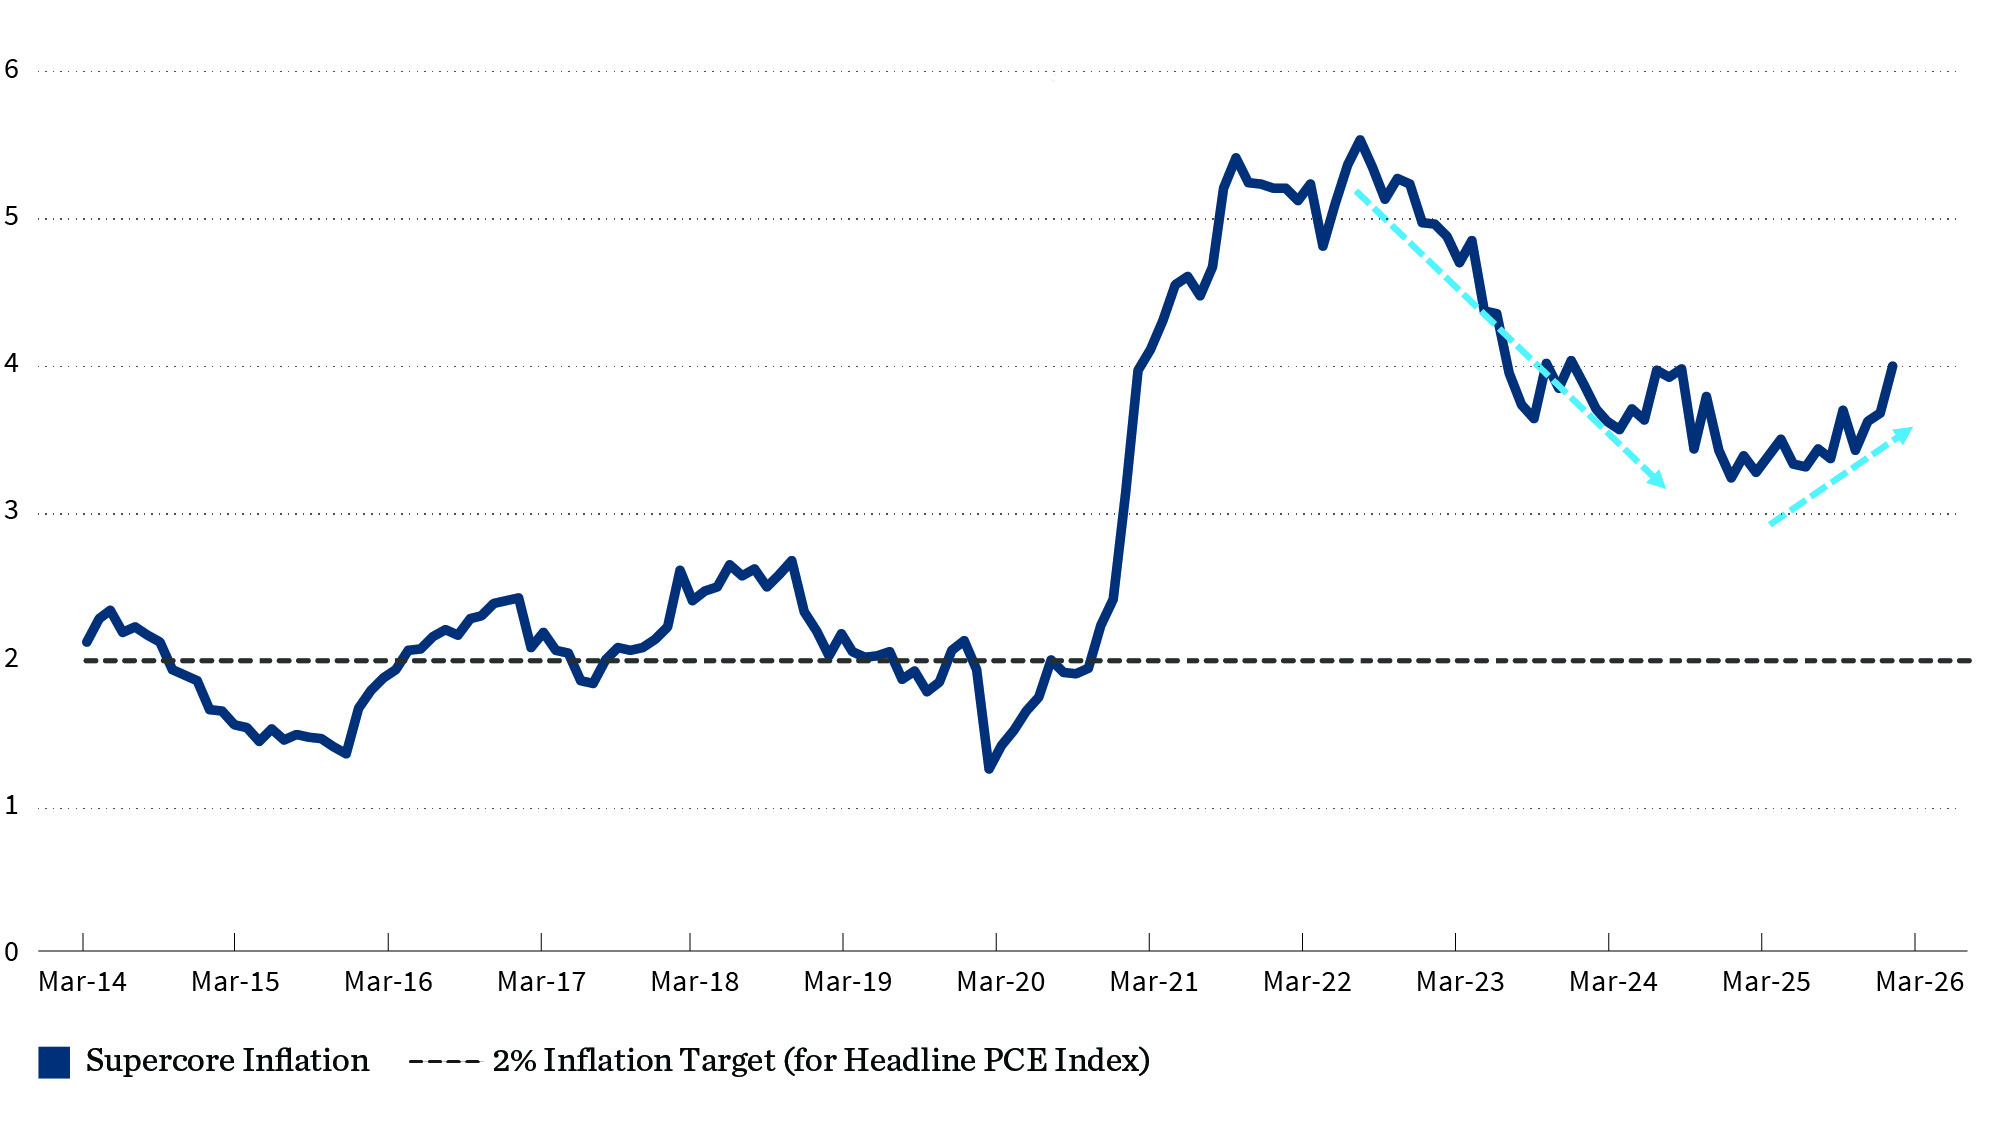
As shown in exhibit 1, inflation has not only remained sticky, but also accelerated. Unfortunately, what this exhibit also shows is that this reacceleration is not entirely the result of the conflict in the Middle East, given that it started before its eruption. While the war has exacerbated the situation, it has been one only in a series of major supply-side shocks in the last five years that have continued to keep inflation elevated. These include COVID, the war in Ukraine, tariffs, immigration restrictions, retiring baby boomers, reshoring/deglobalization, greater policy uncertainty, more tariffs, spending related to the OBBB, and the increased frequency of more extreme weather events.
Supercore PCE Inflation – Services Less Energy & Housing
(% change on year ago)
More Hawkish Kevin Warsh Takes the Helm at the Fed
Inflation is front and center for the newly minted Fed chair, Kevin Warsh, who stated in his first press conference (June 17) that we are well into a sixth consecutive year of above-target inflation, and that his Fed plans to do something about it. The committee’s much-shortened press statement ended with the strong final sentence: The committee will deliver price stability. Yet, with the end of forward guidance, Chair Warsh is refusing to tell us what that something is (i.e., raising rates, shrinking the Fed’s balance sheet, or waiting for the expected disinflationary supply-side improvements from AI to kick in to do the heavy lifting).
Chair Warsh made a number of important announcements at this meeting, one of which was the ending of forward guidance (a tool that in effect had already been eliminated by the recurring so-called one-off supply shocks); the other was the establishment of a series of special taskforces created to decide how the Fed should go about the business of achieving its triple mandate of price stability, maximum employment, and moderate long-term interest rates. In Warsh’s view, markets have been too dependent on being spoon-fed by the Fed for too long. A bit of volatility should make for greater price discovery and a healthier market overall.
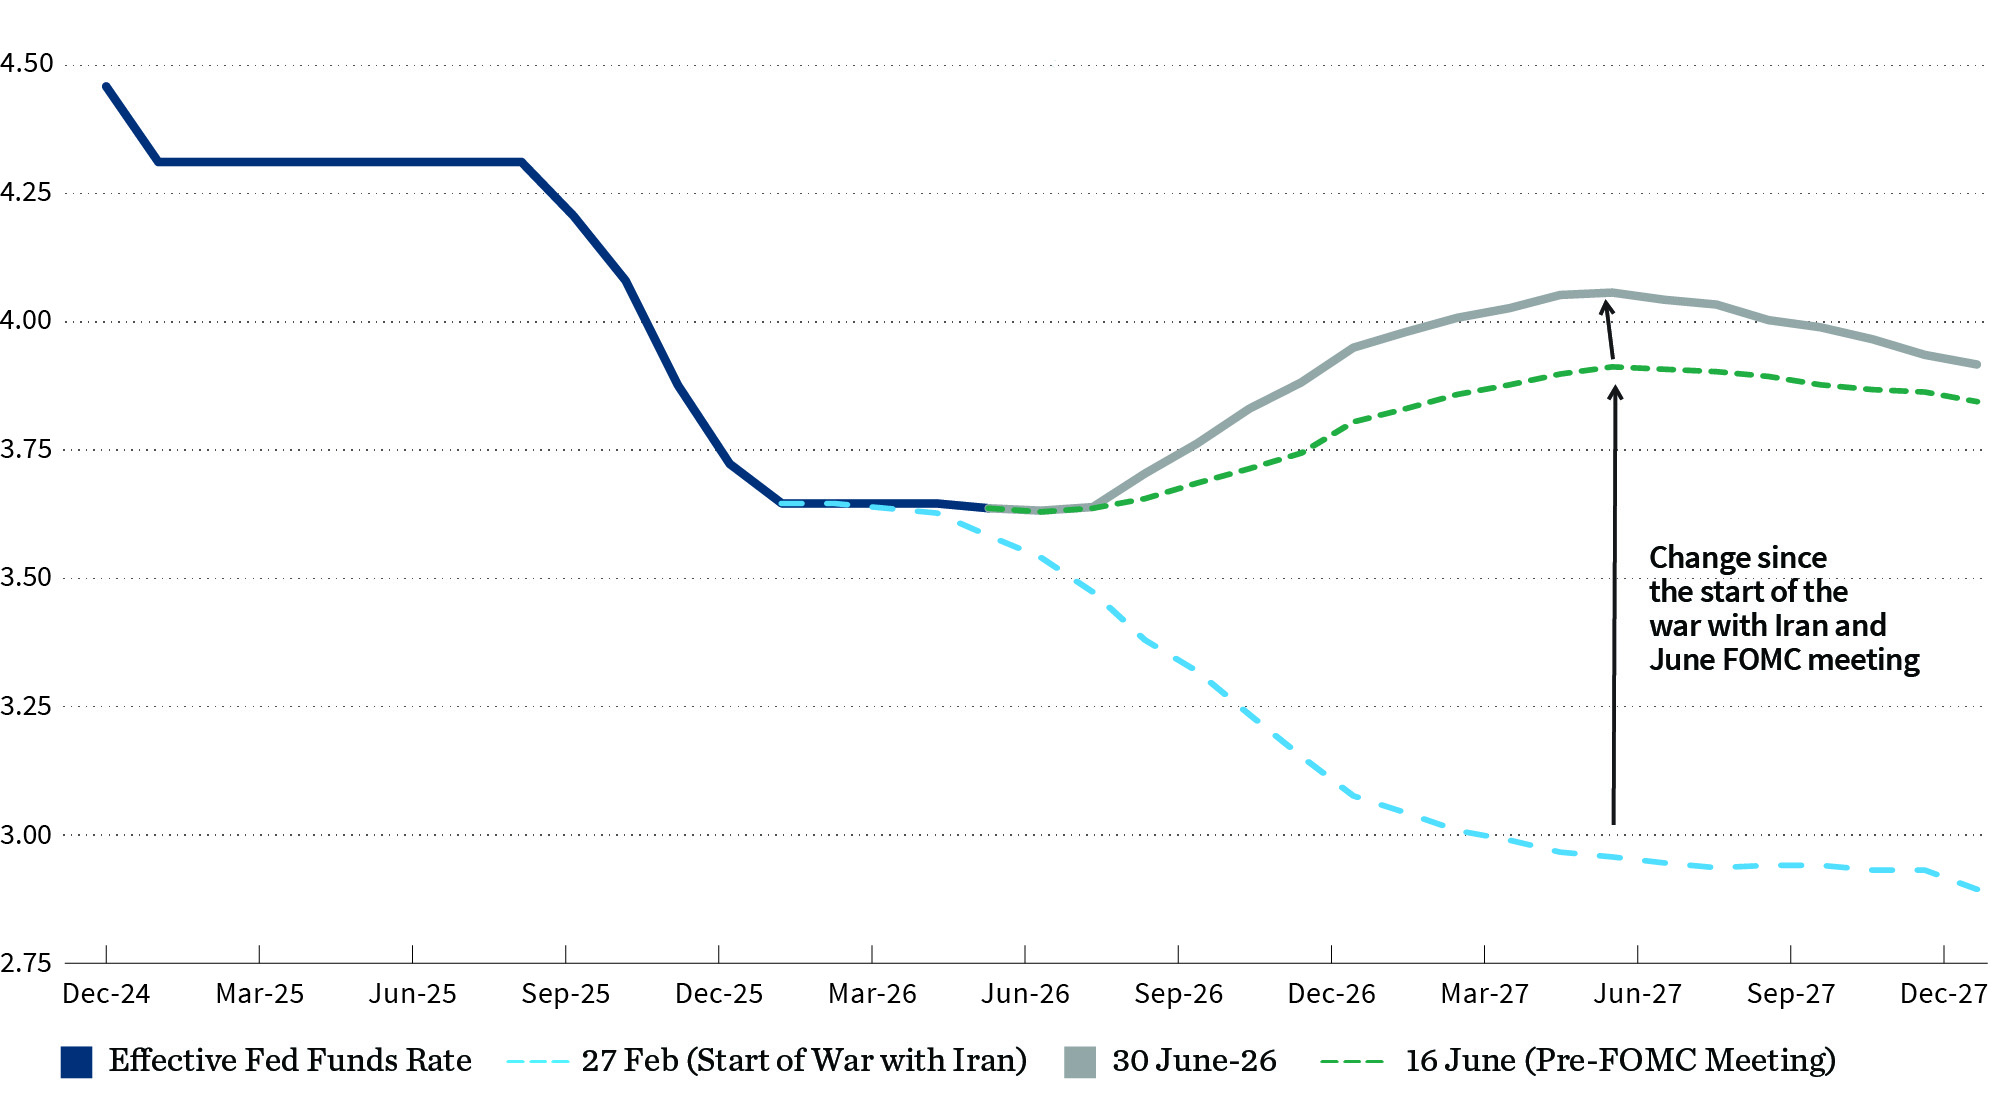
Financial market participants interpreted the more hawkish tone to mean the market would not immediately revert to prewar expectations for a series of rate cuts; rather, there is now an increased possibility of rate hikes starting at the September FOMC meeting, where the probability of an increase has risen to 56%, up from 37.9% earlier in June (exhibit 2).
Fed Funds Rate and Futures Market Expectations
(Expected rate, %)
Greater Equity Market Dispersion Warrants More Active Portfolio Management
The S&P 500 is up 10% for the year, bolstered by a 15% return in the second quarter. Coming off concerns of the Iran war at the end of the first quarter, investors pivoted to focus on the economic engine of AI capital expenditure, driving the market upward. Companies across the AI ecosystem—power generation, construction, tech hardware, and chips—were the biggest movers. The Philadelphia Semiconductor Index, composed of companies that make up the building blocks of AI compute, was up over 80% in the quarter. After several years of outsized returns, the semiconductor industry accounts for 18% of the S&P 500, up from 5% or less before 2023.
On an encouraging note, earnings growth has propelled the market, with analysts raising their expectations that the infrastructure spending on AI and the ensuing productivity-enhancing benefits of the technology will drive strong growth. S&P 500 earnings growth for the year is now expected to be a remarkable 26%.
Not surprisingly, alongside the optimism of continued vast investment in AI and data centers comes some healthy skepticism. CEOs such as Alex Karp of Palantir are vocalizing key questions: Will AI generate enough economic value for companies and consumers to justify the trillions of dollars being invested in AI infrastructure today? Moreover, will companies pay for the higher-priced AI models from the likes of Anthropic and OpenAI, or will they be driven to lower-cost alternatives that are more economically efficient?
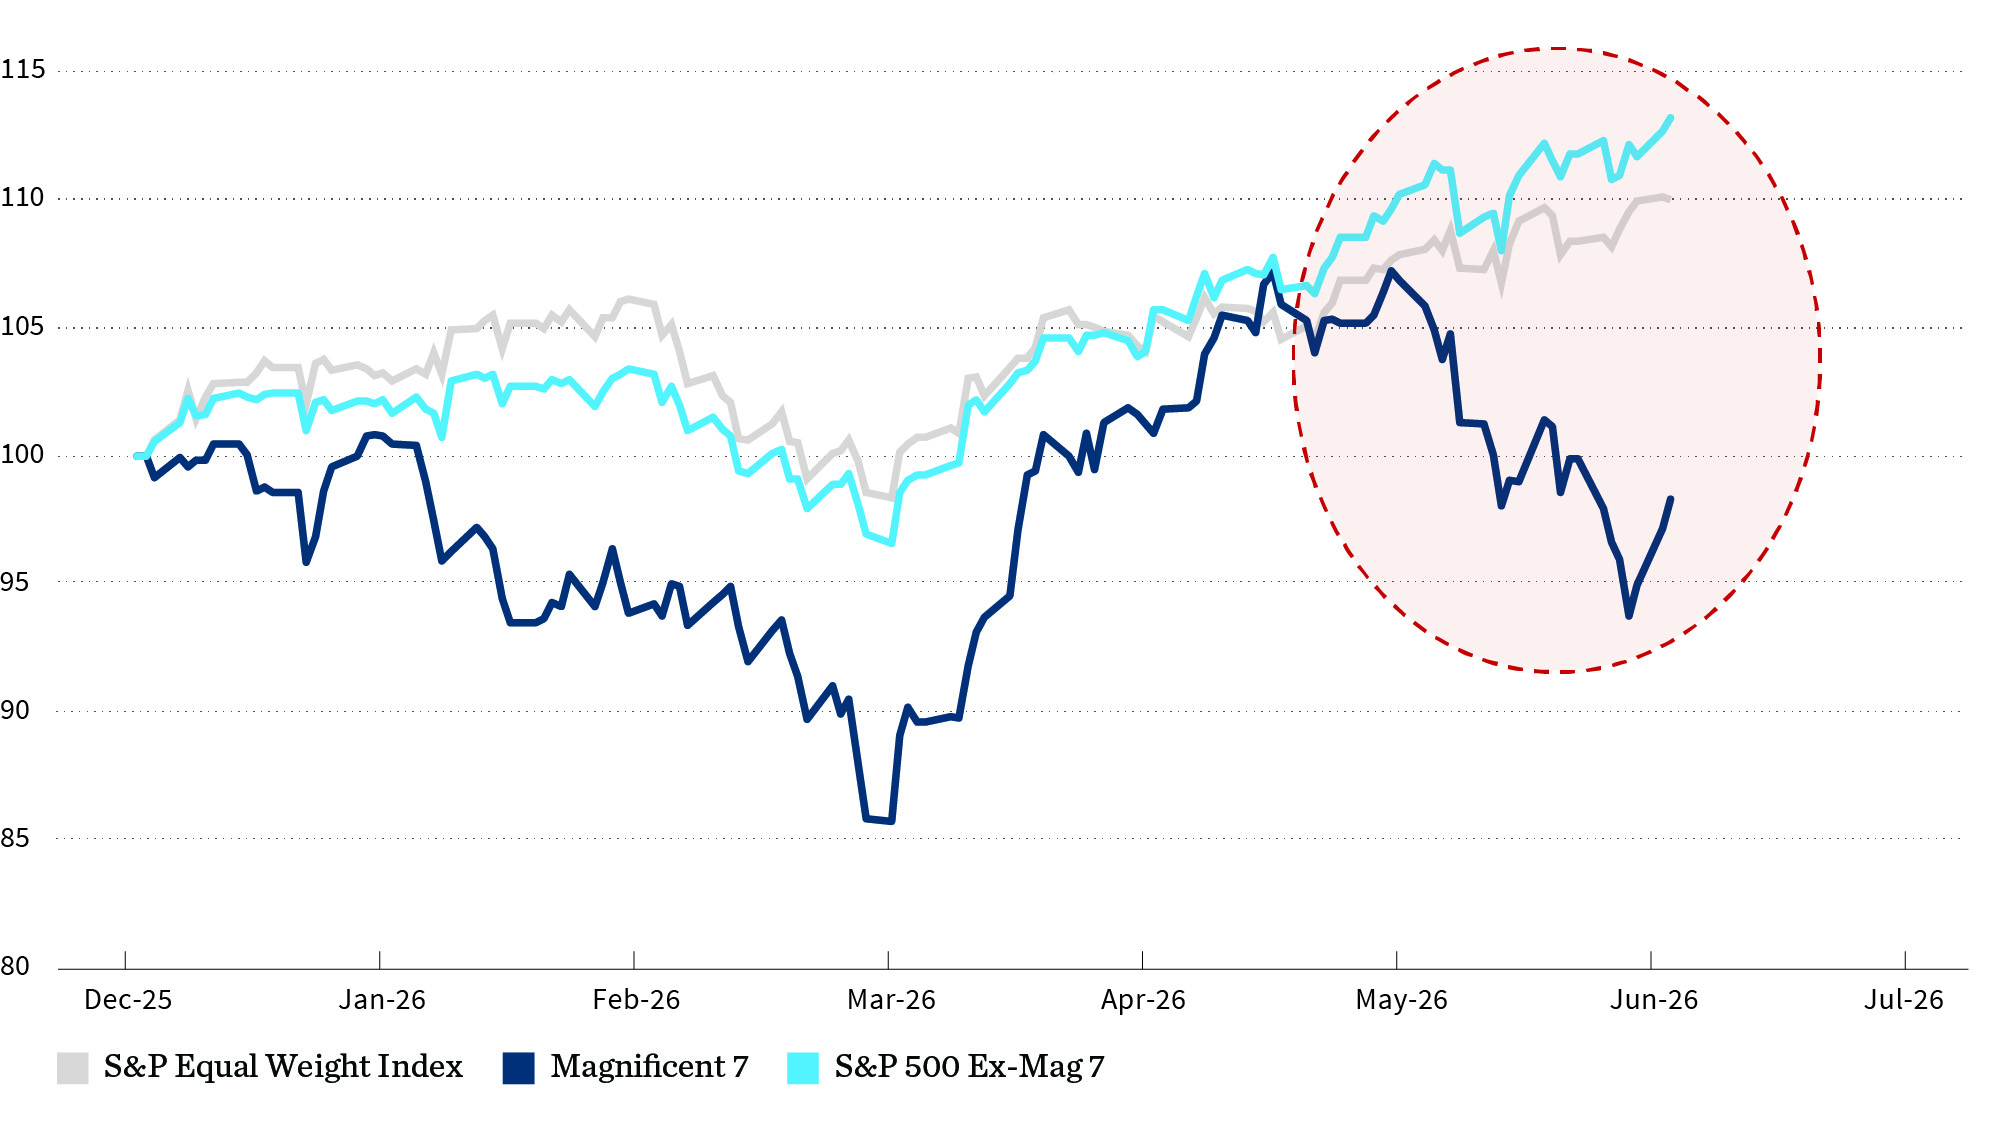
Current capex investment is being fed by exceptionally high levels spending from the hyperscalers (Alphabet, Microsoft, Amazon, Meta, Oracle, etc.), on the basis that future earnings will more than cover the current high levels of expenditure. These companies are using cash flow and issuing debt to finance capex, which is expected to be over $700 billion this year and close to $1 trillion next year. More recently, the market’s reaction to these high levels of spending has tempered. After many years in a row of the U.S. stock market being lifted by the returns of the Magnificent 7, this storied group of stocks has underperformed year-to-date (exhibit 3).
With AI investment driving earnings and GDP growth, if spending were pulled back, there could be a domino effect of market implications. Thus far, we have seen only spending increases from the hyperscaler group; we are watching this dynamic closely.
S&P 500 Index
(Indicies rebased to 100 31 December 2025)
From an asset allocation perspective, portfolio construction and diversification are essential. Over the past decade, market returns of large-capitalization U.S. stocks have bested smaller-capitalization stocks and international indices. The returns of U.S. stocks have been led by technology companies, especially the very large technology companies, which have realized outsized growth and profitability. With the transformative technology of AI at the forefront and uncertain implications, stakes are high and continued market leadership is unclear at this early stage.
As always, the investment environment remains fluid, and periods of volatility and uncertainty are an expected part of the market cycle. Through it all, we remain committed to staying true to what we do: building and managing portfolios with discipline, patience, and a clear focus on your unique investment objectives and goals. We appreciate the trust you place in us and will continue working diligently to help position your portfolio for long-term success.
We hope you enjoy the summer and are able to share it with family and friends.